


Go Beyond JS Console - 🦄 Make Debugging Super With Console API


There is various methods you can use with JavaScript console that make your debugging skills superb. With console methods debug your code easily and faster. In this post we’ll explore some of the main methods made available by the console API.
Logging
const name = 'Unicorn'
console.log('Hello', name) // Hello Unicorn
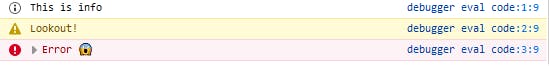
But we have more methods like warn, info, error
console.info('This is info');
console.warn('Lookout!');
console.error('Error 😱');
Tables
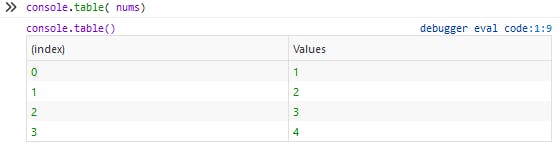
The console.table() method print given info in table format.
var nums = [1, 2, 3, 4, 5]
console.table(nums)
Asserting
The console.assert() method writes an error message to the console if the assertion is false. If the assertion is true, nothing happens.
// this will pass, nothing will be logged
console.assert(2 == '2', '2 not == to "2"');

// this fails, '3 not === to "3"' will be logged
console.assert(3 === '3', '3 not === to "3"');
Clearing
You can clear the console with console.clear:
console.clear();
Counting
Log the number of times this line has been called with the given label.
[1, 2, 3, 4, 5].forEach(num => {
  if (num % 2 === 0) {
    console.count('even');
  } else {
    console.count('odd');
  }
});

// odd: 1
// even: 1
// odd: 2
// even: 2
// odd: 3
Timers
You can start a timer to calculate the duration of a specific operation. To start one, call the console.time() method, giving it a name as the only parameter. To stop the timer, and to get the elapsed time in milliseconds, just call the console.timeEnd() method, again passing the timer's name as the parameter.
console.time('fetching data');
fetch('https://jsonplaceholder.typicode.com/users')
  .then(d => d.json())
  .then(console.log);
console.timeEnd('fetching data');

fetching data: 2ms - timer ended                  debugger eval code:5:9
undefined
Array(10) [ {…}, {…}, {…}, {…}, {…}, {…}, {…}, {…}, {…}, {…} ]
Stack traces
The console object also supports outputting a stack trace; this will show you the call path taken to reach the point at which you call console.trace(). Given code like this:
function foo() {
  function bar() {
    console.trace();
  }
  bar();
}

foo();

console.trace()   debugger eval code:3:13
    bar   debugger eval code:3
    foo   debugger eval code:5
    <anonymous>   debugger eval code:8
Grouping
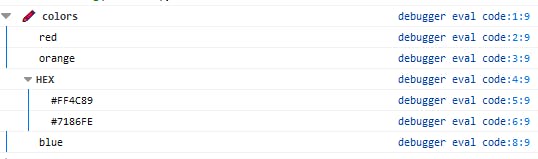
Use console.group and console.groupEnd to group console messages together with an optional label. You can use nested groups to help organize your output by visually combining related material.
console.group('🖍️ colors');
console.log('red');
console.log('orange');
console.group('HEX');
console.log('#FF4C89');
console.log('#7186FE');
console.groupEnd();
console.log('blue');
console.groupEnd();
Giving it some styles
Console logging can be styled using a special %c delimiter:
Everything that comes after the first %c will be styled by the string provided by the given argument, If you want to add other style then everything after the next %c is styled by the second coloe: #eb3d34 string argument.
console.log('Hello %cJavascript%c',
'color: blue; font-weight: bold; font-size: 2rem;')

If you like this article then write me on twitter and share with other people. Read my previous article Dark mode with 1 CSS property here. What's new in ECMAScript ES2020 new features